OSS Burnout Radar: a vitals monitor for the npm packages you depend on
A tool that watches the maintainers, not the popularity contest. Ten signals, one score, citations behind every signal.
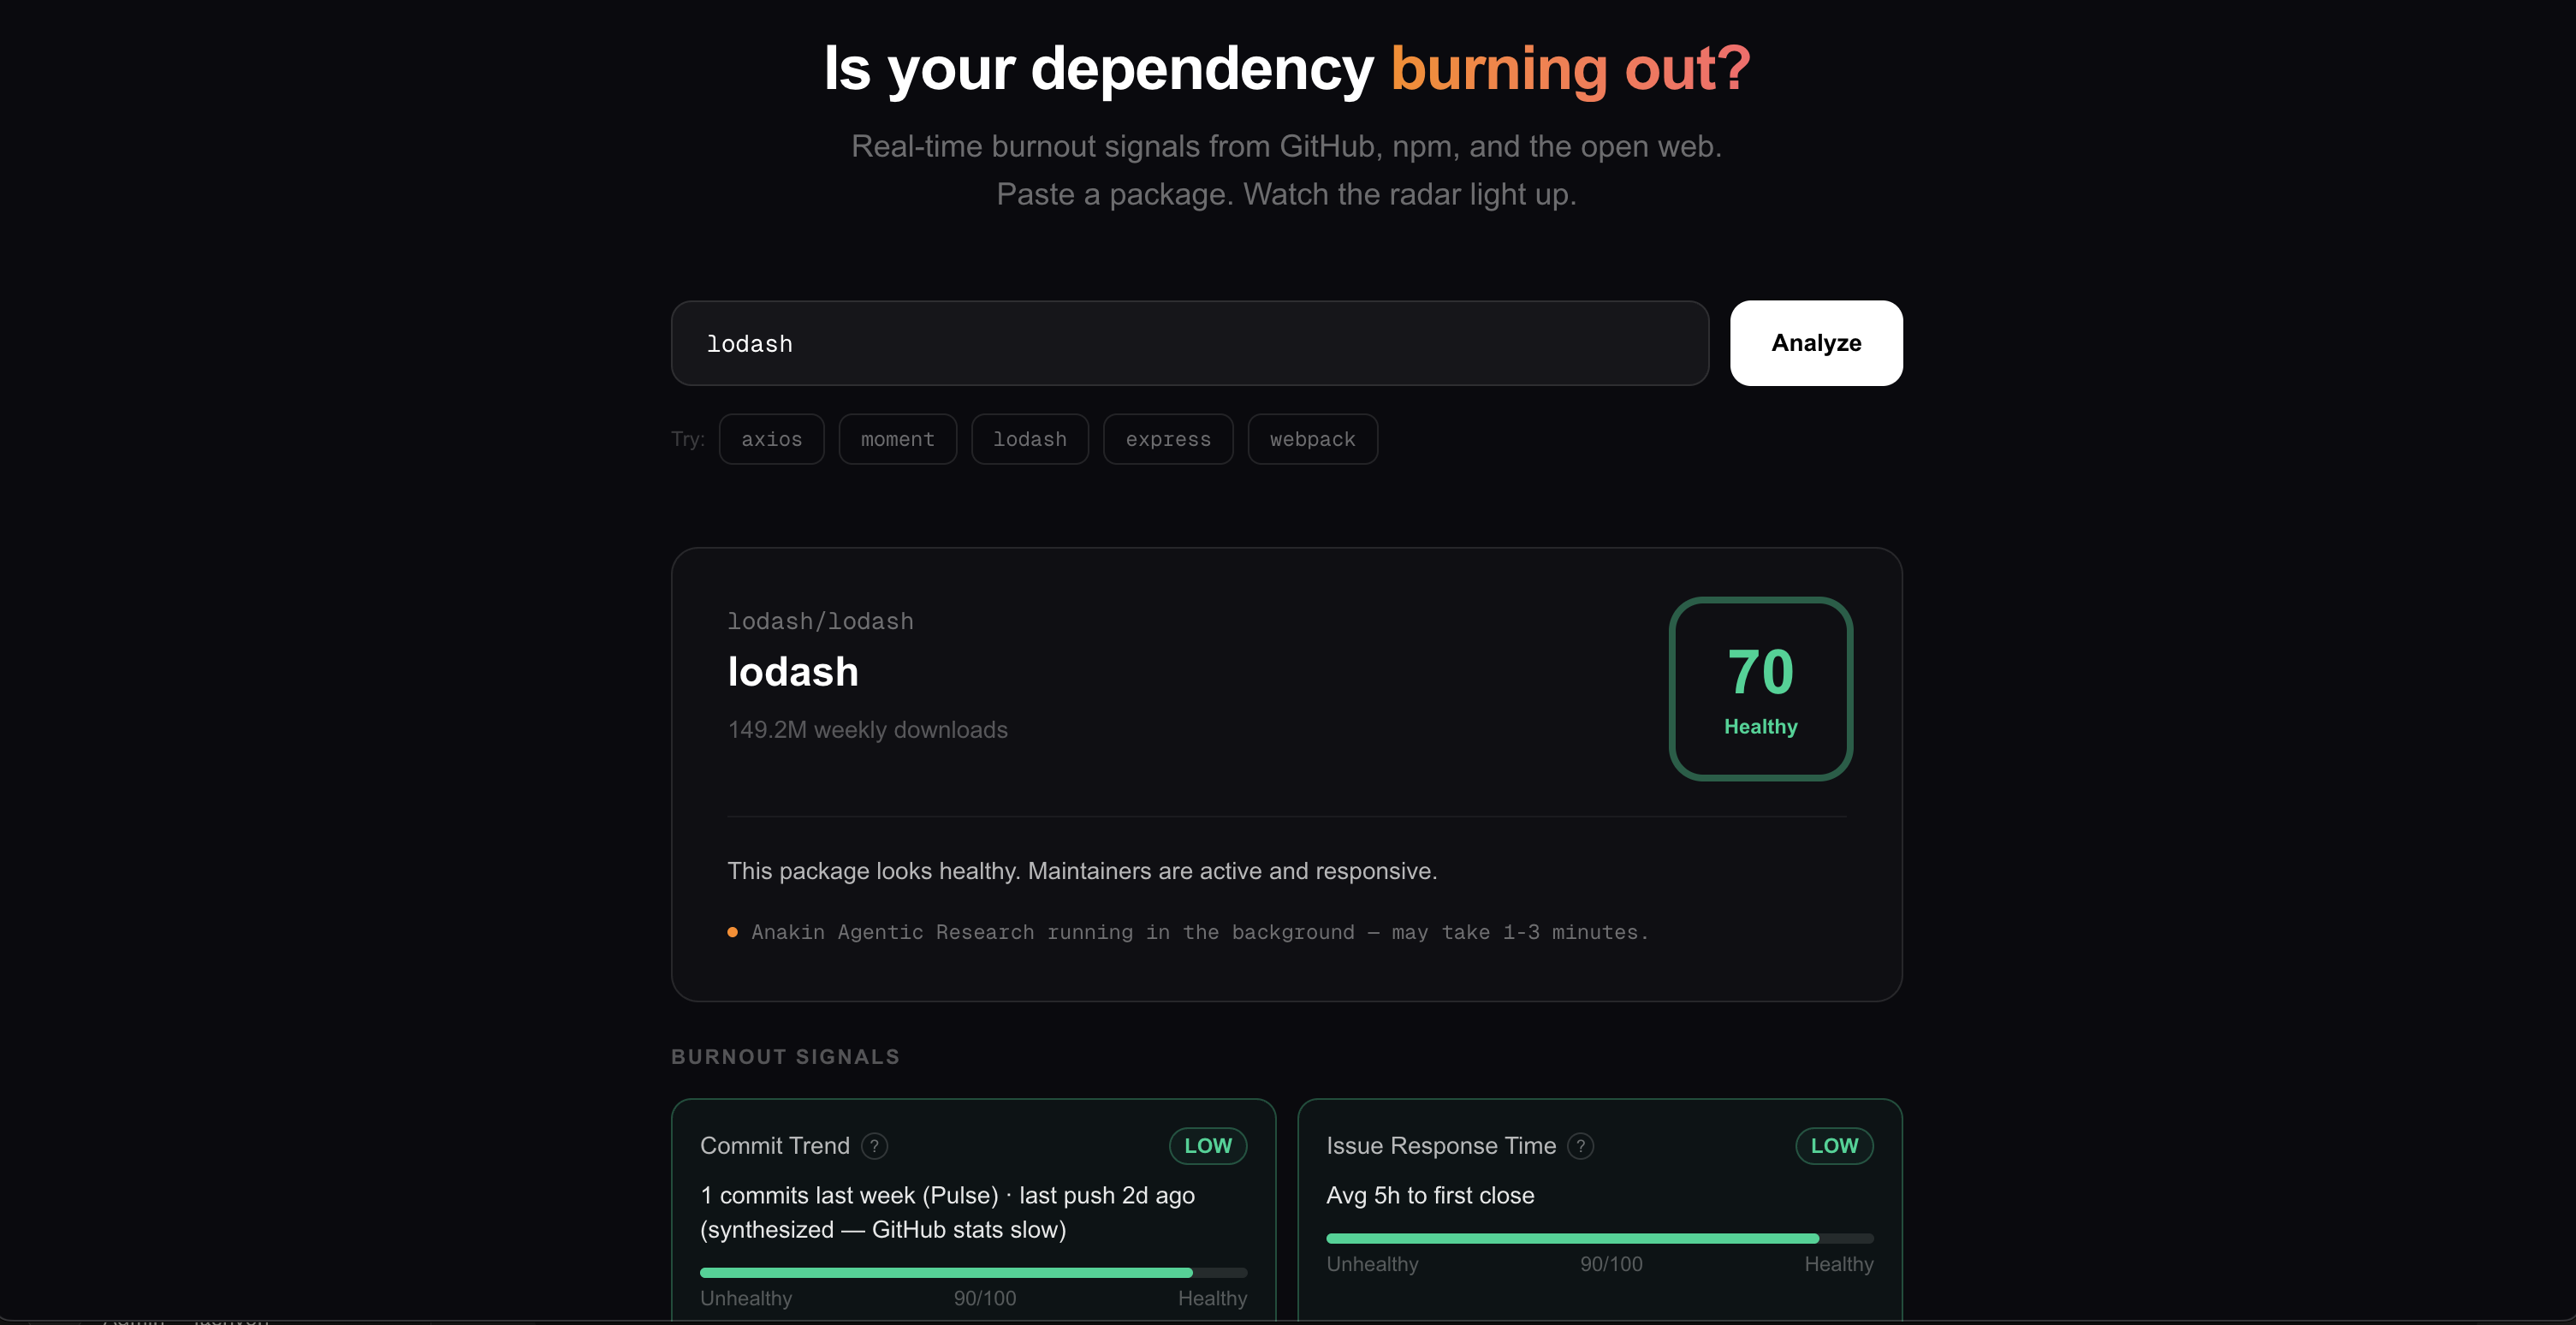
I built this on a long weekend after almost shipping a security patch on top of a package that had quietly gone unmaintained six months prior. The maintainer's last comment on a closed issue was "I'm out of bandwidth, sorry." I read it after I'd already typed npm install. That happens too often.
The signals that say "this person is about to stop maintaining their package" exist. They're scattered. The lone maintainer writing a "looking for maintainers" note on issue #842. The release timestamp drifting from monthly to "11 months ago." One person owning 100% of recent commits while the issues queue grows. Stars and weekly downloads — what most teams actually look at — move way after any of those.
So I built a tool that watches the maintainers, not the popularity contest. Paste a package name, watch ten signals stream into one screen, get a 0–100 burnout score with citations behind every signal. The whole thing runs on Anakin's scraping and agentic-search APIs, plus a thin layer of GitHub direct API for the things GitHub already exposes cleanly.
This post is what I'd hand to someone wanting to build a similar tool: the architecture, every Anakin endpoint we hit and why, the patterns that turned out to matter, and the traps that ate hours.
Live: oss-burnout-radar.vercel.app · Source: github.com/gitshreevatsa/OSS-Burnout-Radar
What it does
Type a package name. Watch the signals come in.
SIG  | Pulse Activity         score=90  | Last week: 22 PRs merged · 24 issues closed · 16 authors
SIG  | Release Cadence        score=90  | latest 7d ago · median gap 8d · 9 recent releases
SIG  | Bus Factor             score=90  | 100 contributors · top owns 21%
SIG  | Maintainer Tone        score=55  | neutral · 0 burnout phrases, 0 positive phrases
…
DONE | overall=75 risk=LOW
That's axios. Healthy. The 25%-weighted "Burnout Research" signal isn't in that snapshot because it runs as a separate background job — agentic search across HN, blogs, and discussions takes a couple of minutes. When it lands, the score updates and a panel below shows the citations.
Every signal card has a hover tooltip that explains what it measures and which API or scraper produced it. Every piece of evidence links to its source. The realistic read: nothing is "vibes." The score is reproducible from the citations.
The shape of the app
                                 ┌─ Per-collector 120s budget ────────┐
                                 │                                     │
POST /api/analyze (NDJSON) ──────┼─→ 9 fast collectors ───→ aggregate  │
                                 │       │                              │
                                 │       └─→ Anakin instrumented client│
                                 │             │                        │
                                 │             ├─ urlScraper            │
                                 │             ├─ crawl                 │
                                 │             ├─ search ─── circuit ───┤
                                 │             └─ agenticSearch ────────┤
                                 │                                       │
                                 └─→ ensureResearchJob() (background) ───┤
                                                                         │
GET /api/analyze/research (SSE) ←── poll job-store ──── (background) ←───┘
Two routes. One streams the fast signals (NDJSON, ~30s wall clock). One streams the slow research signal (SSE, ~3min cold). The UI subscribes to both as soon as you hit Analyze.
Every signal is a Collector that returns a 0–100 score and a weight. Aggregation is a weighted average over the signals that succeeded. Failed signals drop out of the weight pool, so a missing data point doesn't pull a healthy package toward 50 by averaging it against neutral.
The Anakin services we ride on
Anakin-first as a constraint that turned into a strength. The alternative was writing five custom HTML scrapers, a sentiment classifier, and a multi-stage agentic search pipeline myself. Anakin has all of that as endpoints with one API key. Once I sat down with the docs, things clicked into place pretty fast.
Every Anakin endpoint we touch:
| Anakin service | What it powers | Why this endpoint |
|---|---|---|
POST /v1/url-scraper (+ poll) | Pulse Activity (/pulse), Release Cadence (/releases), Maintainer Tone fallback (/issues), npm Reach (npmjs.com), Bus Factor fallback (/graphs/contributors) | These pages render data the REST API doesn't expose. /pulse weekly rollups have no GitHub API equivalent. npmjs.com only shows dependents and maintainers in the rendered DOM. |
POST /v1/crawl (+ poll) | Discussions Health — multi-page traversal across /discussions (8 pages, includePatterns: ["/discussions"]) | URL Scraper is single-page. Discussions span paginated lists. Crawl is the Anakin verb built to follow links by pattern. |
POST /v1/agentic-search (+ poll) | Burnout Research — the headline 25%-weighted signal. Sends a structured prompt and a JSON Schema, gets back riskLevel, summary, evidence[], citations[]. | Replaces a build-out of HN scraper + blog crawler + sentiment classifier + LLM synthesis with one call. Schema-driven extraction keeps the output structured. The biggest single unlock in the project. |
POST /v1/search | Reserved. The Stack Overflow signal got removed (SO has lost relevance for OSS dependency questions in 2026). | Kept the typed method in the client for future use. HN-specific or Reddit-specific search drops in cleanly when I add those signals. |
GET /v1/holocron/catalog | Probe at /api/debug/holocron. Lists pre-built actions for our account. | If Anakin adds Holocron actions for npm or GitHub, we'd switch to those instead of bespoke scrapers. The probe lets us see new actions without redeploying. |
WebSocket /v1/browser-connect | Not used — reserved. | Future: scraping authenticated GitHub views (private metadata, gated discussions). Pairs with Browser Sessions. |
POST /v1/sessions (Browser Sessions) | Not used — reserved. | Future: bypassing GitHub's login wall on certain /issues URLs by reusing a saved session. |
For the signals where direct GitHub APIs are strictly faster (issues, contributors, repo metadata), GitHub REST is primary and Anakin scraping is the fallback. There was a decision moment around this. The brief was "Anakin for everything," and I considered routing all GitHub data through url-scraper for consistency. But scraping GitHub takes ten to fifteen seconds per page versus sub-second for the REST API, and the data is identical. Slower and cosmetically tidier loses to faster every time. So the architecture is Anakin-first where Anakin gives you something the direct API can't, and direct-first where the REST API is just faster.
The instrumented proxy that saved my afternoon
If I'm allowed one decision out of this entire project that I'm happy with, it's this one. Every Anakin call goes through a thin proxy that records the call name, arguments, duration, status, and any error. The proxy fans out to three places: stdout, the NDJSON response stream as instrumentation events, and a 200-call ring buffer that backs /api/debug/last-analysis.
async function instrument<T>(
  call: AnakinCall,
  argsSummary: string,
  fn: () => Promise<T>,
): Promise<T> {
  const startedAt = Date.now()
  try {
    const result = await fn()
    record({
      call,
      argsSummary,
      durationMs: Date.now() - startedAt,
      status: 'completed',
    })
    return result
  } catch (err) {
    record({
      call,
      argsSummary,
      durationMs: Date.now() - startedAt,
      status: 'failed',
      error: err.message,
    })
    throw err
  }
}
Twelve lines. That's the whole pattern.
Why I'm happy with it: when Anakin's Perplexity quota got exhausted mid-development, the failure mode was that /search and /agentic-search would return cryptic 500s and "Anakin job failed." Without instrumentation, debugging that would have been hours of guessing. With instrumentation, the actual error message ("perplexity: Unexpected error: 401 - You exceeded your current quota") was in the structured stdout log within thirty seconds of the first failed call. I knew exactly which upstream provider was broken and that there was nothing I could fix on my end.
Add observability before you need to debug. The cost is a thin wrapper. The payoff is finding root causes in seconds instead of hours.
Streaming signals over NDJSON
The natural API shape would be one POST that returns a JSON object once all signals are collected. Works fine. Also means you stare at a spinner for a minute. I wanted users to see the radar light up signal by signal, the way htop updates instead of dumping everything at the end.
The standard option for that is Server-Sent Events. SSE has one annoying constraint: EventSource only does GET. You can't put a request body in a GET, so the package name would need to go in a query string, which is fine but feels off for a "submit and process" verb.
What I did instead is stream NDJSON over a normal POST. Each chunk is one JSON object on its own line.
{ "type": "meta", "packageName": "axios", "repo": "axios/axios", "collectors": [...] }
{ "type": "instrumentation", "record": { "call": "urlScraper", "durationMs": 11268, ... } }
{ "type": "signal", "signal": { "key": "pulse_activity", "score": 90, ... } }
{ "type": "signal", "signal": { "key": "release_cadence", "score": 90, ... } }
{ "type": "done", "burnout": { "overall": 76, "risk": "LOW" }, ... }
The client reads response.body as a stream, splits on newlines, parses each line. About fifteen lines of client code total. No library. No protocol. The request body works.
const reader = res.body.getReader()
const decoder = new TextDecoder()
let buffer = ''
while (true) {
  const { value, done } = await reader.read()
  if (done) break
  buffer += decoder.decode(value, { stream: true })
  let nl: number
  while ((nl = buffer.indexOf('\n')) !== -1) {
    handleEvent(JSON.parse(buffer.slice(0, nl)) as StreamEvent)
    buffer = buffer.slice(nl + 1)
  }
}
Worth knowing: any time you have "submit something, get many ordered events back over time" and the events are structured, NDJSON over POST beats SSE. SSE's superpower is auto-reconnect, which doesn't matter for a one-shot analysis call.
Decoupling the slow signal
The headline signal — Burnout Research — runs agentic-search. Four-stage pipeline (refine the query, search the web, scrape citations, synthesize). On a cold cache it takes anywhere from sixty seconds to five minutes.
Holding an HTTP connection open that long is a bad idea on basically every layer of the stack. Vercel hobby caps you at 300 seconds. Browser fetch happily times out before that. Network blips drop the stream. Each of those means the user sees a timeout.
So the architecture splits into two endpoints. The main POST /api/analyze returns the nine fast signals in fifteen to thirty seconds. It also kicks off the research job in the background, fire-and-forget. A second endpoint, GET /api/analyze/research, is an SSE stream that subscribes to the in-flight job (or returns the cached result if it has already finished). The client opens this SSE connection as soon as it receives the meta event from the main POST.
First time you analyze axios, the research panel shows a "still working" spinner for a minute or two. Second time you analyze it within 24 hours, the result lands instantly from cache.
The trap was: my in-memory job store works fine on a single dev server. On Vercel each lambda invocation can land on a different instance, so for production you'd want Vercel KV or Redis. The interfaces are narrow enough (ensureResearchJob, getResearchJob) that it's a small swap. Haven't done it yet.
The circuit breaker
When /search and /agentic-search started failing because of the Perplexity quota, every collector that called them was wasting five seconds per attempt waiting for a 500. Two SO calls per analysis, ten seconds gone. Plus credits.
A small circuit breaker fixed it. The first failure that classifies as "Perplexity quota" trips the circuit. Subsequent calls return immediately with a "circuit open" error. After five minutes, the circuit half-opens and the next call gets to try.
async search(query, opts) {
  ensureCircuitClosed('search')
  try {
    return await request('/search', ...)
  } catch (err) {
    if (err.status >= 500) tripCircuit('search', err.message)
    throw err
  }
}
Textbook pattern. Surprisingly underused in client code that calls third-party APIs. The bug it prevents is the one where one bad upstream stalls every request indefinitely.
The traps along the way
The regex that ate eight signals
When I tested the app on ethers, every signal came back blank or wrong. Issue Backlog showed 0 open / 0 closed. Maintainer Tone scraped what looked like a GitHub login wall. Bus Factor showed zero contributors. I assumed Anakin was misbehaving and started writing a fallback chain.
The actual root cause: I had a regex parsing the GitHub repo path out of npm's repository.url field. The regex was /github\.com[:/]([^/]+\/[^/.]+)/, parsing username/reponame, where reponame was "any character that isn't a slash or a dot." ethers lists its repository as git://github.com/ethers-io/ethers.js.git. My regex stopped at the first dot, parsing the repo as ethers-io/ethers. That repo doesn't exist on GitHub. Every API call hit a 404. Every Anakin scrape got a generic GitHub redirect.
One regex fix. Eight signals fixed at once.
// before
const match = repoUrl.match(/github\.com[:/]([^/]+\/[^/.]+)/)
// after
const match = repoUrl.match(/github\.com[:/]([^/#?]+\/[^/#?]+)/i)
return match ? match[1].replace(/\.git$/i, '') : null
The lesson, which I should have known: when many things break at once, suspect a shared dependency before you suspect each consumer. And: write unit tests for input parsers, even when they look trivial. The fix took ninety seconds. Finding it took an hour.
The Perplexity quota that vanished mid-build
/search and /agentic-search both run on Perplexity. One afternoon, both started returning 500s with "Failed to perform search." Anakin's URL Scraper and Crawl were unaffected — different infrastructure on their side.
The instrumented proxy already had the actual error in stdout. Within thirty seconds I knew it was Perplexity's quota, not Anakin's. Forwarded the upstream error verbatim to the Anakin team. They topped it up the same day. Without the proxy, this would have looked like "the app sometimes fails for no reason." With the proxy, it was "external dep is over quota, here's the upstream error message verbatim."
Build the observability before you need it. Every time.
The "small package isn't unhealthy" rebalance
A user testing the tool typed date and saw it score 40 (At Risk). They thought that was wrong. I thought about it for a while.
date has 3.1k weekly downloads, one author, last push 116 days ago. From a pure burnout-detection standpoint, that's not "perfectly healthy." Solo authors burn out. Packages going four months without a push do drift. Was the score wrong? Or was the user's intuition wrong?
The rubric was wrong, in a subtle way. The original scoring punished low values across the board. Low downloads, low score. No releases, low score. One contributor, low score. Stack those penalties and any small mature library lands in "At Risk" regardless of whether it's actually risky.
What I changed: low values now anchor on "is the project still being touched?" If pushed_at is recent (less than 60 days), no recent releases doesn't pull the score down. That's a stable mature library, not a fading one. If pushed_at is two years stale, no recent releases is bad. Same data point, different context, different answer.
The product is named "Burnout Radar," but people use it as "should I depend on this?" — which isn't quite the same question. A healthy mature library that doesn't change because it doesn't need to is a fine dependency. The scoring should reflect that.
After the rebalance, date scores 46 ("Watch") and axios still scores 75 ("Healthy"). Sanity preserved on both ends.
What I'd do differently
The two stores that hold state in memory (response cache and research job map) need to be Redis or KV before this runs at any scale. I knew that when I shipped the first version. Wanted to see the system work end-to-end before optimizing the persistence layer. In retrospect, swapping in Vercel KV from the start would have cost an extra hour and avoided the "yes, this works, but it won't on Vercel hobby across instances" footnote.
I'd probably also make the Burnout Research signal opt-in. It's the most expensive single signal in credits and time, and most users will close the tab before it lands. The other nine signals already get you 90% of the way there.
What's next
The architecture is general enough to add signals without touching anything but a single collector file. On the list:
- —A crawl over the project's docs site to check freshness — broken links, last-edit timestamps, version drift between docs and the latest release. Anakin's
crawlalready does multi-page traversal. - —A security-advisory cadence signal. GitHub publishes per-repo advisories at
/{repo}/security/advisories. One URL Scraper call away. - —A dependency-churn signal. How often the package's own dependencies are getting bumped, parsed from
package.jsonhistory. - —Cross-package signals. If you depend on twenty packages and three share a maintainer who just posted "stepping back," that's worth flagging.
— shreyas